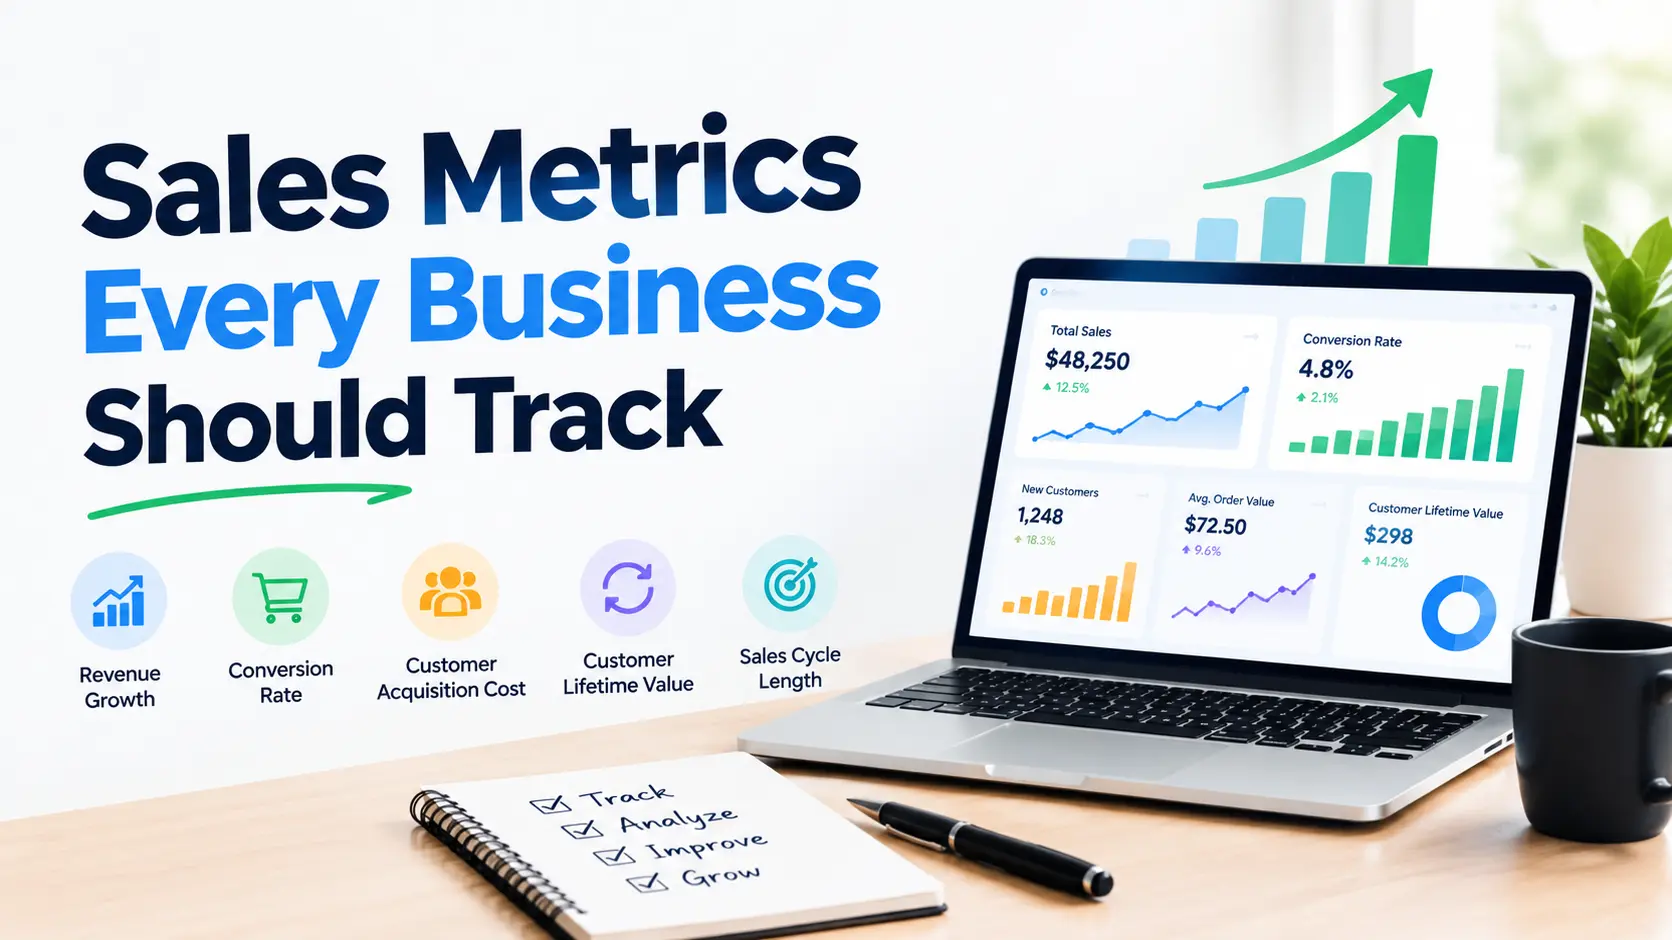
Sales Metrics Every Business Should Track
If you have ever tried to navigate a ship through a thick fog without a compass, you know exactly how it feels to run a business without tracking sales metrics. You might be moving, but are you moving in the right direction? Sales metrics are the heartbeat of your organization. They tell a story about what is working, what is failing, and where you need to pivot before your resources run dry. By keeping a close eye on these indicators, you are not just guessing; you are making data driven decisions that can turn a struggling startup into a market leader.
Understanding Customer Acquisition Cost (CAC)
Think of Customer Acquisition Cost as the price of admission to your business. It is the total amount of money you spend on marketing and sales to win a single new customer. If you spend 10,000 dollars on ads and sales commissions in a month and land 10 new customers, your CAC is 1,000 dollars. Simple, right? But the danger lies in ignoring the hidden costs. You need to include software subscriptions, content creation, and even the salaries of the people involved in the funnel. If your CAC exceeds the value that a customer brings, you are essentially paying people to do business with you, which is a fast track to bankruptcy.
Maximizing Customer Lifetime Value (CLV)
While CAC tells you what you pay to get a customer, Customer Lifetime Value tells you how much that relationship is actually worth over time. It is the total revenue you can reasonably expect from a single customer account. If your CAC is 500 dollars but your CLV is only 300 dollars, you have a major problem. You want to see a healthy ratio where CLV is significantly higher than CAC. To boost this, focus on retention strategies, upselling, and cross selling. Think of your customers as a garden; you do not just want to plant the seeds, you want to nurture them so they grow over years, not just weeks.
The Science Behind Your Conversion Rate
Conversion rate is the percentage of leads that actually turn into paying customers. It is the ultimate filter for your sales process. Are your marketing efforts bringing in junk leads that never buy, or are you attracting high quality prospects? If your conversion rate is low, your funnel might be leaking. You might need to refine your targeting, improve your messaging, or perhaps train your sales team to handle objections more effectively. Imagine your funnel as a sieve; if the mesh is too wide, everything slips through. Your job is to tighten that mesh until you are catching only the best opportunities.
Cracking the Code on Sales Velocity
Sales velocity measures how fast your deals move through the pipeline. It is calculated by multiplying the number of opportunities by the average deal size and the win rate, then dividing that by the length of the sales cycle. Essentially, it tracks how quickly you are making money. If you want to increase your revenue, you either need to increase the speed at which you close, increase your deal size, or increase the number of qualified prospects. It is the most comprehensive metric for understanding your overall sales health.
Why Average Deal Size Matters More Than You Think
Not every sale is created equal. Your average deal size gives you a benchmark for what a typical transaction looks like. If you notice your average deal size dropping, it might mean your team is discounting too heavily, or perhaps you are attracting smaller customers who do not align with your product’s value. Increasing your average deal size through bundling or premium tiering is often much easier than finding thousands of new customers. It is like choosing between catching a hundred minnows or one large tuna; sometimes, efficiency comes from depth rather than breadth.
Lead Response Time: Speed Is a Competitive Advantage
In the digital age, patience is a dying virtue. If a lead fills out a contact form on your website and you wait three days to call them back, they have likely already gone to a competitor. Lead response time tracks how long it takes for a sales rep to reach out to an inbound lead. Studies consistently show that the odds of qualifying a lead drop significantly if you wait more than five minutes. Your goal should be instant gratification. Set up automated workflows to alert your team the moment a lead comes in so that you can strike while the iron is hot.
Keeping Your Bucket Full: Analyzing Churn Rate
Churn rate is the enemy of growth. It measures the percentage of customers who stop doing business with you over a given period. If you are gaining 10 customers but losing 10 every month, you are running in place. High churn is usually a sign that your product, service, or customer support is falling short. You should analyze why people leave. Is it a pricing issue? Are they not getting the results they expected? Fixing churn is often more profitable than acquiring new customers because it costs much less to keep an existing client happy than to find a replacement.
Measuring Your Sales Growth Rate
Sales growth rate shows your trajectory over time. It compares your revenue from one period to another, such as this month versus last month, or this year versus last year. This metric is what investors and stakeholders look at to gauge the vitality of your business. Consistent, double digit growth is the gold standard. If your growth is stagnant, you need to look back at the other metrics we have discussed. Are you not getting enough leads, or are you just failing to close them? Growth rate is the final verdict on your collective efforts.
Quota Attainment: Are Your Reps Hitting the Mark?
Quota attainment measures the percentage of your sales team that is hitting their individual sales targets. If only one star performer is hitting their numbers while the rest of the team is failing, you have a training or hiring problem. Quota attainment helps you identify which reps need coaching, which processes are ineffective, and whether your targets are even realistic. It is a mirror for your management style. Are you setting your team up for success, or are you setting them up for burnout?
Pipeline Coverage: Planning for Future Success
Pipeline coverage is the ratio of potential deals in your pipeline to your sales quota. If your quota for the month is 100,000 dollars, you should have significantly more than that in active, qualified opportunities in your pipeline to ensure you hit your goal. Think of it as a buffer. You need coverage because deals fall through, budgets get slashed, and priorities change. A healthy pipeline usually has three to four times the amount of value needed to meet the quota.
Monitoring Your Average Sales Cycle Length
How long does it take for a lead to become a customer? That is your sales cycle length. If it takes six months to close a deal for a 500 dollar product, your business model is likely unsustainable. Knowing your average cycle helps you forecast revenue accurately. If you know that your average cycle is 90 days, you can look at the leads you are getting today and make a fairly accurate guess about what your revenue will be in three months.
The Truth Behind Your Win Rate
Your win rate is the percentage of opportunities that you successfully close as sales. It is the final step in the journey. If you have a high number of leads but a low win rate, your team might be wasting time on unqualified prospects. Improving your win rate is all about qualification. By getting better at saying “no” to the wrong leads early, you save time and energy to focus on the ones who are ready and willing to buy.
Distinguishing MQLs from SQLs
Not every lead is a golden ticket. An MQL, or Marketing Qualified Lead, is someone who has engaged with your content but might not be ready to buy. An SQL, or Sales Qualified Lead, is someone who has been vetted and is ready for a direct sales conversation. Mixing these up is a common mistake. You need a clear process for moving leads from the marketing stage to the sales stage. This prevents your sales team from wasting time on people who are just window shopping.
Conclusion: Turning Data Into Action
Tracking these metrics is not just about filling out a spreadsheet; it is about building a scalable engine for your business. When you measure what matters, you empower your team, optimize your processes, and ultimately drive sustainable growth. Do not try to track everything at once, but start with the ones that impact your bottom line the most. As your business evolves, your focus may shift, but the habit of checking the data should remain constant. Treat these metrics as your map, and you will navigate the business world with confidence.
Frequently Asked Questions
1. How often should I review these sales metrics?
Most businesses benefit from a weekly review for operational metrics like lead response time, and a monthly review for broader metrics like CLV and churn. Consistency is more important than frequency.
2. What is the most important metric for a startup?
For a new business, CAC and Conversion Rate are usually the most critical because you need to prove that you can acquire customers profitably before scaling up.
3. Can too many metrics hurt my business?
Yes, it is called analysis paralysis. Focus on five to seven key performance indicators that directly influence your specific business goals rather than tracking dozens of vanity metrics.
4. How do I improve a low win rate?
Start by analyzing why you are losing deals. Are you losing on price, features, or trust? Use that feedback to refine your sales pitch and improve your qualification process.
5. Should I use CRM software to track these?
Absolutely. Trying to track these metrics manually in a spreadsheet is prone to error and incredibly time consuming. A CRM helps automate data collection and gives you real time insights.